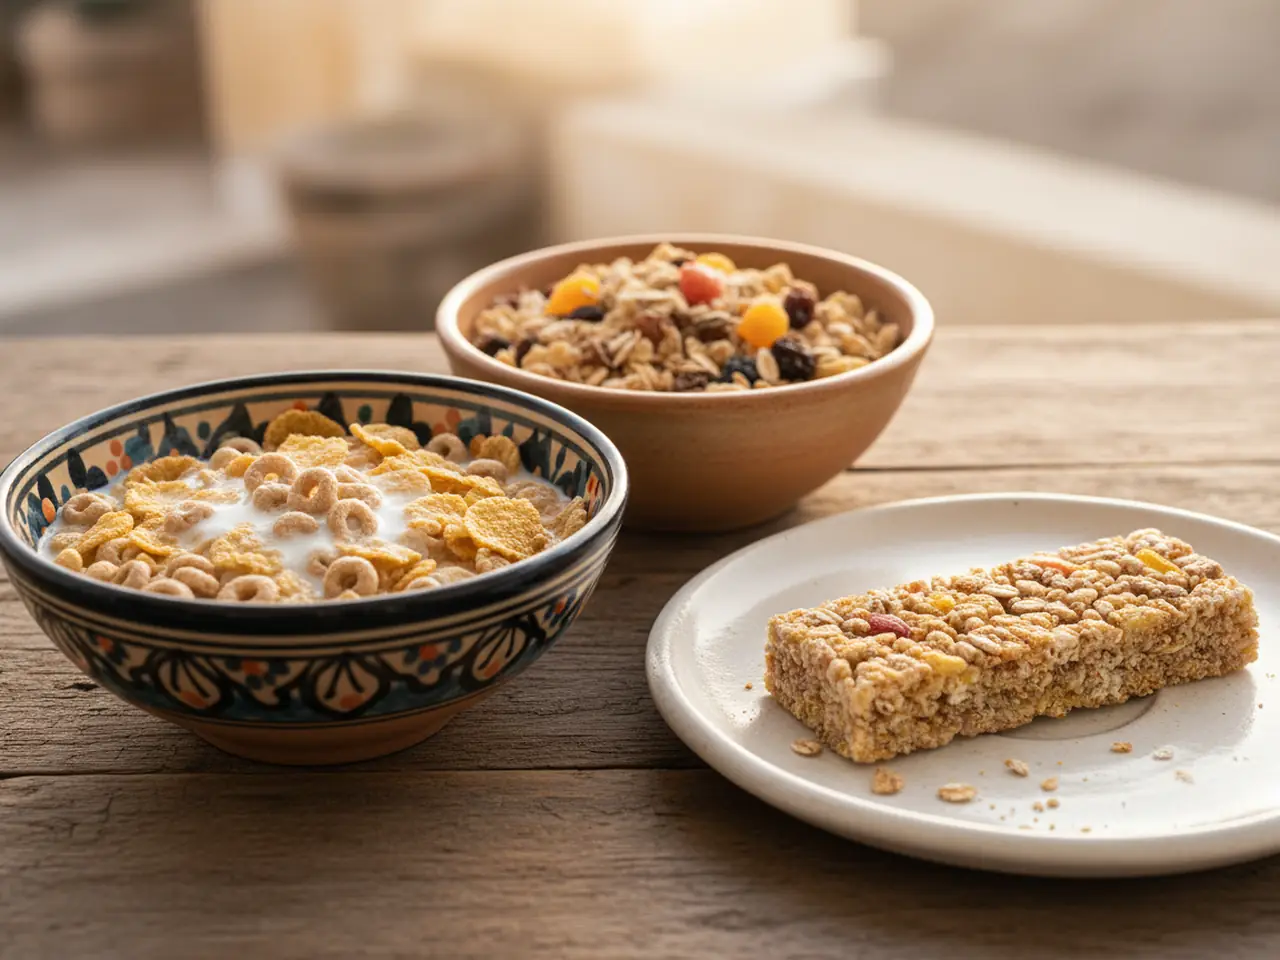
To compare products, look at the per 100 g column. The serving size is set by the manufacturer. The ‘sugars’ in the table are all sugars, including the lactose in milk and the sugars in fruit. Salt is calculated from sodium. In UK labelling, more than 22.5 g of sugars, 17.5 g of fat, 5 g of saturates or 1.5 g of salt per 100 g counts as high.
The table on the back of the pack always has the same lines in the same order, across the whole European Union. The law calls it the ‘nutrition declaration’, and it has been mandatory on most prepacked foods since 13 December 2016. Once you learn to read it, you can compare two products in a few seconds.
What it must show
Regulation 1169/2011 sets out which lines the table has and in what order:
| Line | What to note |
|---|---|
| Energy (kJ and kcal) | These are two units for the same energy. Calories are the kcal |
| Fat | All fats |
| of which saturates | The fats that should be kept low |
| Carbohydrate | Starch and sugars together |
| of which sugars | All sugars, both natural and added |
| Protein | |
| Salt | Calculated from sodium |
Dietary fibre (in the law simply ‘fibre’) is optional. It must be listed only when the pack makes a claim about fibre, such as ‘source of fibre’. The same applies to mono-unsaturates, polyunsaturates, starch and vitamins.
Some foods do not need a table. Among them are unprocessed foods with a single ingredient, herbs, salt, coffee, tea and very small packs.
Per 100 g or per serving?
The per 100 g column (or per 100 ml for liquids) is mandatory. The per serving column is optional, and the serving is set by the manufacturer. That is why one cereal may have a ‘serving’ of 30 g and another of 45 g.
Take, for example, a cereal bar with fruit, with values from the app’s food database:
| Per 100 g | Per 25 g bar | % reference intake per bar | |
|---|---|---|---|
| Energy | 382 kcal | 95 kcal | 4.8% |
| Fat | 6.5 g | 1.6 g | 2.3% |
| of which saturates | 3.5 g | 0.9 g | 4.4% |
| Carbohydrate | 73.3 g | 18.3 g | 7.0% |
| of which sugars | 30.4 g | 7.6 g | 8.4% |
| Protein | 6.1 g | 1.5 g | 3.1% |
| Salt | 0.7 g | 0.2 g | 3.1% |
The 8.4% per serving does not look like much. Per 100 g, though, the bar has 30.4 g of sugars, so almost a third of its weight is sugars. To compare products, always use the per 100 g column. Look at the serving only to see how much you will eat.
The ‘% reference intake’
Many packs show a percentage next to the numbers. It is the percentage of the ‘reference intake of an average adult (8,400 kJ/2,000 kcal)’. The reference values are the same for all products:
| Reference intake for one day | |
|---|---|
| Energy | 2,000 kcal |
| Fat | 70 g |
| Saturates | 20 g |
| Carbohydrate | 260 g |
| Sugars | 90 g |
| Protein | 50 g |
| Salt | 6 g |
These values are not a target for you. Your needs may be very different from 2,000 kcal. Nor are the 90 g of sugars an ‘allowed’ amount. The World Health Organization recommends keeping free sugars below 10% of energy. Free sugars are the sugar added to foods, honey, syrups and fruit juices. At 2,000 kcal this means less than 50 g a day. It also suggests below 5%, about 25 g, as a conditional recommendation, because the evidence for that limit is weaker.
Sugars, salt and kJ
Sugars. The ‘of which sugars’ line counts all the sugars in the food. In plain yoghurt it is the lactose from milk, in dried fruit the natural sugars of the fruit. The European table has no separate line for added sugar. To find it, you look at the ingredients.
Salt. It is calculated with the formula sodium × 2.5. So it also counts the sodium naturally present in the food. Some packs say this next to the table: ‘the salt content is exclusively due to the presence of naturally occurring sodium’.
Energy. It is calculated from the nutrients with fixed factors: 9 kcal for each gram of fat, 4 for carbohydrate and protein, 2 for fibre and 7 for alcohol.
The ingredients
The ingredients list starts with the ingredient present in the largest amount and goes down from there. If sugar or glucose syrup is near the top, the product has a lot. Ingredients below 2% can be listed at the end in any order the manufacturer chooses.
When an ingredient appears in the name or the picture, the pack must also state its percentage. On a ‘strawberry yoghurt’ you can see how much strawberry it has per 100 g.
The 14 allergens defined by law, such as milk, egg, gluten and nuts, stand out in the list in bold, a different font or a different colour. The phrase ‘may contain traces’ is optional. The manufacturer adds it when they consider that traces may carry over from another product they make.
Plain yoghurt, cheese and butter may have no ingredients list at all. The law allows this for cheese, butter and fermented milk or cream when nothing has been added except milk products, enzymes and cultures, and, in most cheeses, salt.
The colours in half a minute
In the United Kingdom there is a voluntary scheme that puts a ‘traffic light’ in green, amber and red on the front of the pack. Its thresholds are useful for judging any nutrition table:
| Green | Amber | Red | |
|---|---|---|---|
| Fat | up to 3 | 3 – 17.5 | over 17.5 |
| Saturates | up to 1.5 | 1.5 – 5 | over 5 |
| Sugars | up to 5 | 5 – 22.5 | over 22.5 |
| Salt | up to 0.3 | 0.3 – 1.5 | over 1.5 |
Energy does not get a colour in this scheme. For drinks, the thresholds for fat, saturates and sugars are half, per 100 ml. For salt the green threshold stays at 0.3 g. The green thresholds match those set by European law for the claims ‘low fat’, ‘low sugars’ and others. More in the article on ‘sugar-free’ and ‘light’.
Enter the numbers from a pack you have in front of you:
- Fat–
- Saturates–
- Sugars–
- Salt–
Colours follow the thresholds of the official UK front-of-pack labelling. The thresholds for drinks are half. Nothing you type is stored.
The MesogeaFit scan uses the same thresholds, with a few adjustments for Mediterranean diet foods such as olive oil and nuts. This is our own choice, not law. We explain it on the Science page.
How accurate the numbers are
The numbers in the table are averages. The manufacturer may get them from laboratory analysis, from a calculation based on the ingredients or from recognised databases. Official checks accept some deviation. For example, when a food has less than 10 g of sugars per 100 g, the actual value may differ by up to 2 g from the one on the label.
The order we suggest
- Look at the per 100 g column to compare.
- Check sugars, saturates and salt against the thresholds shown above.
- Read the first 3 ingredients.
- Work out the energy for the amount you will eat, not for the manufacturer’s serving.
Sources
- Regulation (EU) No 1169/2011 on the provision of food information to consumers (2011). Consolidated text of 1/4/2025: Articles 9, 18, 19, 21, 22, 30–36, 55, Annexes I, II, V, VII, XIII, XIV, XV. EUR-Lex
- Department of Health (United Kingdom) (2016). Guide to creating a front of pack (FoP) nutrition label for pre-packed products sold through retail outlets. gov.uk
- European Commission (2012). Guidance document for competent authorities for the control of compliance with EU legislation with regard to the setting of tolerances for nutrient values declared on a label. PDF
- World Health Organization (2015). Guideline: Sugars intake for adults and children. who.int
Last checked: October 2026. This article gives general information for adults and does not replace advice from a doctor or dietitian. If you find a mistake, write to us at info@mesogeafit.com.
The amounts for your own meals
MesogeaFit works out the grams of each meal from your details and corrects them every 2 weeks from your weigh-ins.